Gut feeling is no longer an effective method of managing a workforce in the modern enterprise. Consider an executive team preparing for a major expansion. They realize only after it is too late that turnover in critical technical positions is at its highest in a long time.
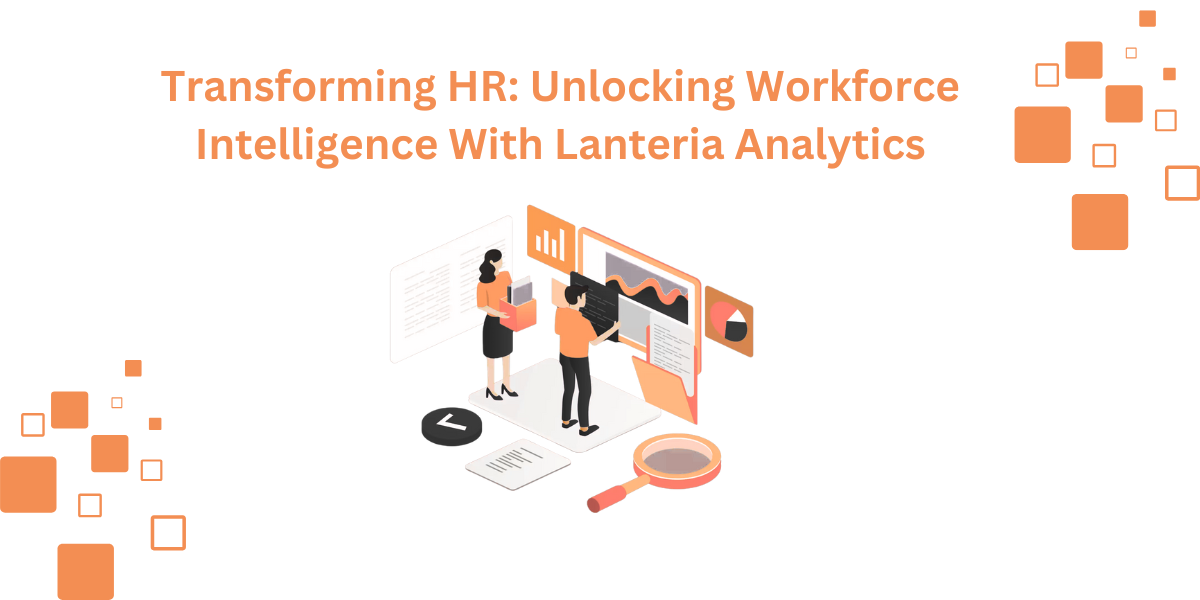
They are operating without real-time information. This blog explains how Power BI HR dashboards turn fragmented data into a clear strategic roadmap. It explores the what, why, and how of HR analytics, with a focus on the synergy between Lanteria HR and Power BI.
You will know how to stop working with static PDFs and interactive insights that work to improve business success. We will look at the kind of reports you require and how to automate your logic to get the best out of it.
What Is An HR Dashboard?
HR dashboard is a central business intelligence tool. It captures, analyses, and documents human capital metrics on a real-time basis. It is your People Operations flight deck. You do not need to scroll across spreadsheets to get a visual summary of your workforce health.
These dashboards combine data from modules, such as payroll, recruitment, and performance, into one. They make complex data understandable at a glance with the help of charts, heatmaps, and KPI cards. In the case of large organizations, this leads to a unified source of truth for all decisions involving people.
HR metrics are no longer nice-to-have tools. They are the key indicators that define your overall corporate strategy. Before major initiatives, executives consult HR reports since people are the major asset of the organization.
By using analytics, you can:
Identify Trends: Detect early rising absenteeism and prevent it before it has an impact on productivity.
Reduce Costs: Find out the areas of recruitment that are costly but yield low-quality recruitments.
Enhance Retention: Predictive models will be used to determine departments with high turnover.
Ensure Equity: Check the pay disparities between demographics to keep up with the legal requirement and justice.
Key Categories Of HR Reports
You should classify your data in order to construct an efficient dashboard. Lanteria HR makes this easier by arranging reports into functional modules that give a reflection of the employee lifecycle.
Workforce And Talent Reports
These include the fundamentals of who and where your business is. They comprise organizational designs, the number of heads turned over, and diversity rates. Salary planning, bonuses, and budget consumption can also be tracked here.
Time And Attendance
This category is dedicated to employee presence. You are able to track vacation statistics, out-of-office calendars, and absence records. By recognizing the areas of unplanned leave, managers can respond to possible burnout or understaffing.
Performance And Growth
Performance reports monitor competencies, employee feedback, and KPI progress. They are essential in succession planning. They assist you in finding the "high potentials" that are fit to take up leadership positions.
Learning And Development
These reports calculate the ROI of your training programs. You are able to trace development requirements, certification, and training budget use. It makes sure that your workforce competency is consistent with future business objectives.
Measures recruiting performance and identifies performance lag in hiring pipelines.
Retention
Voluntary turnover
% of voluntary exits
Surfaces culture or management problems before they escalate.
Diversity
Gender/age ratio
Workforce composition
Assures a diverse, balanced workforce across teams and seniority levels.
Finance
Revenue per FTE
Output per headcount
Maps individual workforce data directly to organisational profitability.
Learning
Course completion %
L&D completion rate
Monitors the development of in-house capabilities and skills retention.
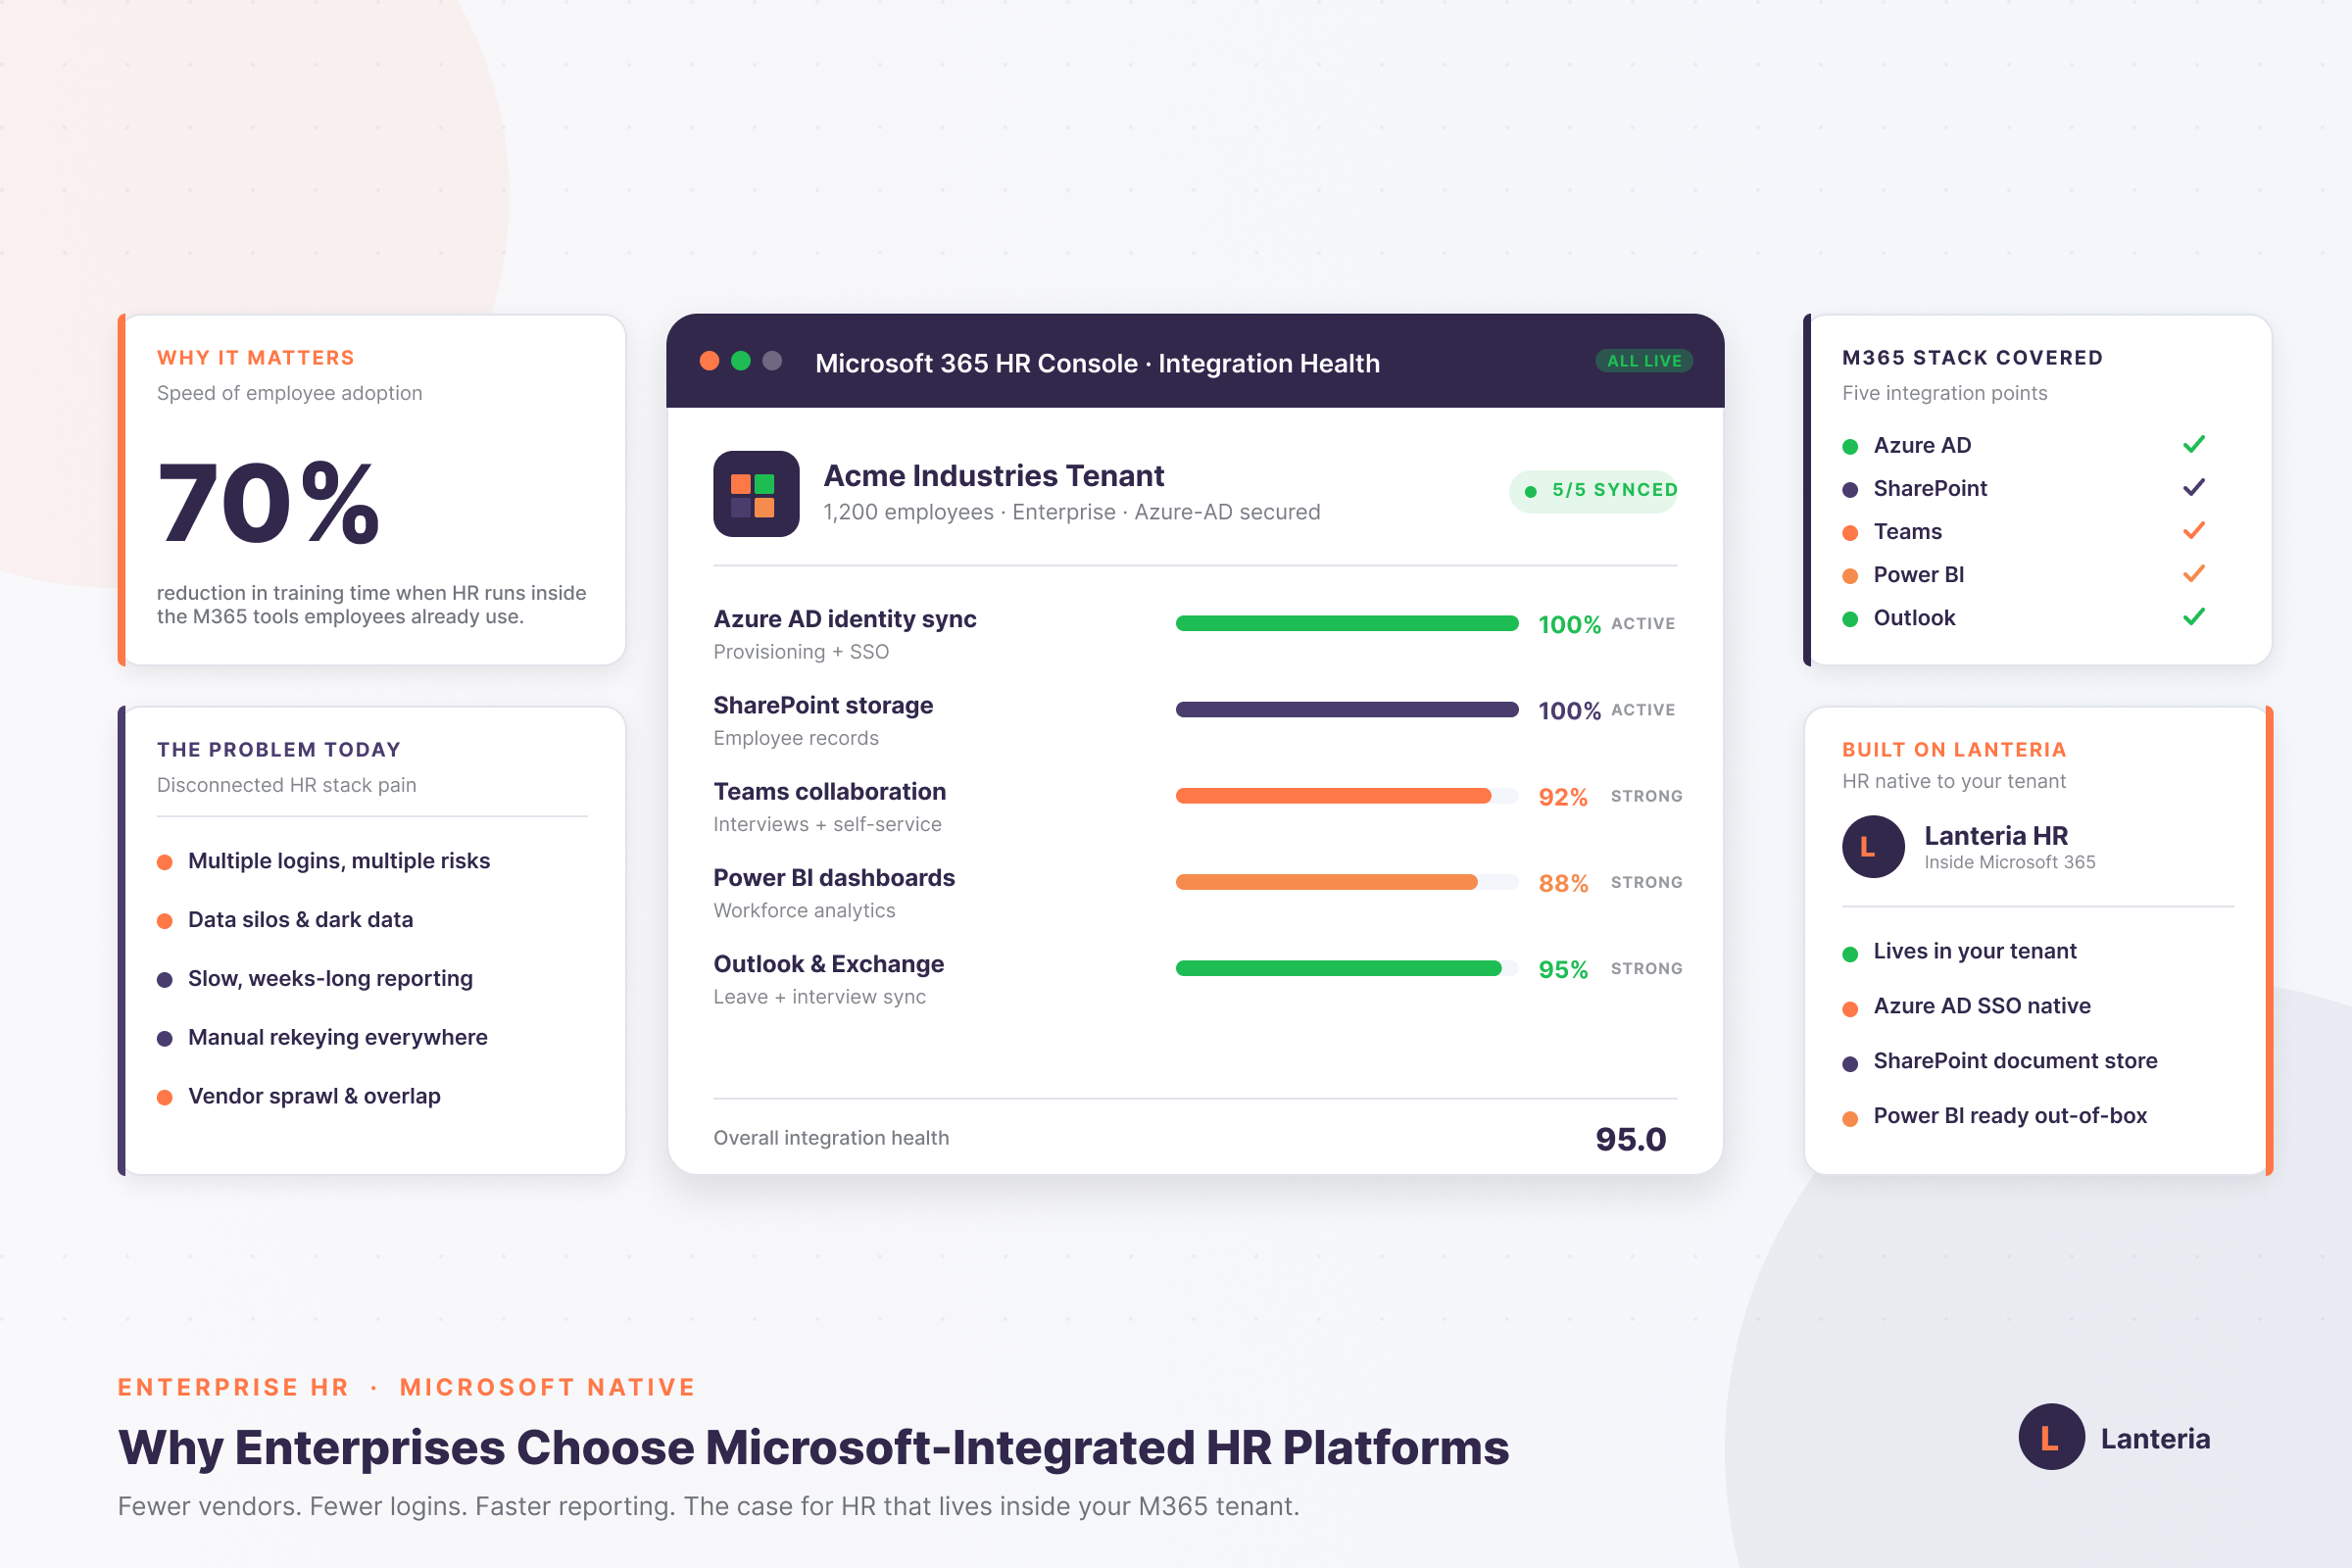
How To Build A Dashboard In Power BI With Lanteria
The creation of a custom dashboard is a logical process. Assuming that you may be aware of data engineering, the significance of a clean pipeline is. The following is the way you can connect Lanteria HR data to Power BI, as I like doing things in six steps.
Step 1: Find Your API Endpoint
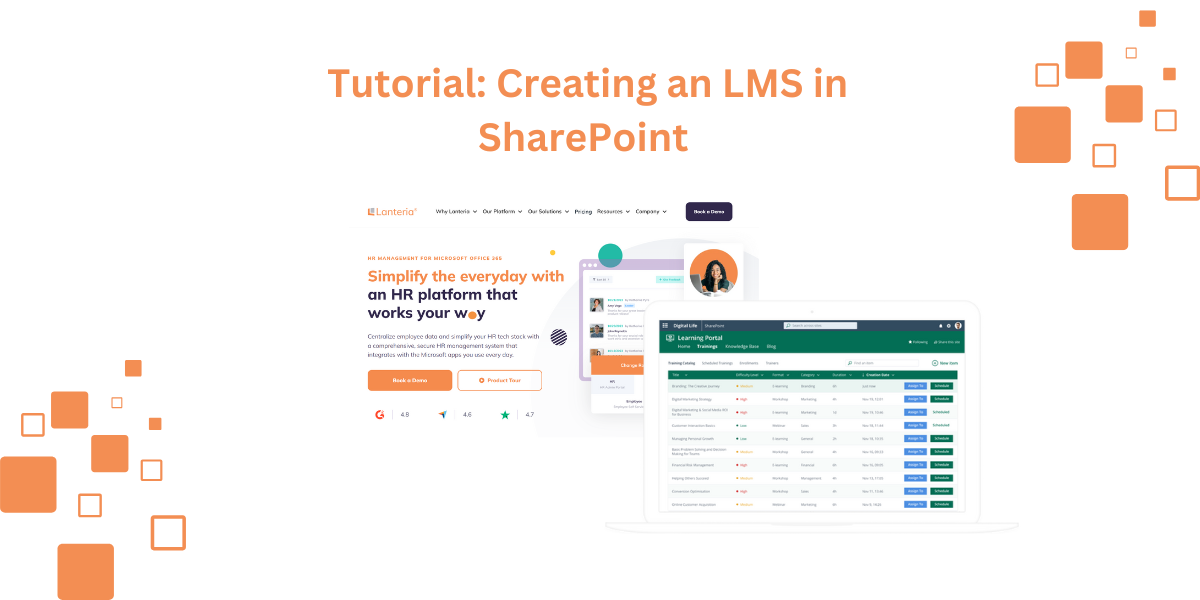
Lanteria HR is based on Microsoft SharePoint and Office 365. You are able to extract data from SharePoint lists or the OData feed. This is your link between your HR database and your visualization tool.
Step 2: Reverse Engineer Logic
It is necessary, prior to constructing visuals, to know how your metrics are computed. Are seasonal contractors considered in Turnover? Calculate your reasoning first so that your Power BI DAX formulas align with your internal HR policies.
Step 3: Location And Query Handling
Filter your information at the point of origin. In case you just require the data of individual offices, such as the Miami or Sydney office, then Power Query can be used to filter the data by location. This will save you data and make your reports fast.
Step 4: Paging And Looping
When you are working with big enterprise datasets, have your queries support it. The records will be looped through to retrieve the entire dataset using Power BI. After pulling data, one may start data parsing in order to clean the data.
Step 5: Data Parsing And Output
You get a dynamic dashboard instead of a plain CSV. Begin with high-level KPI cards of total headcount. Add bar charts to make interdepartmental comparisons. Use drill-down features to allow the users to click a department in order to view team metrics.
When Should You Implement These Tools?
Yesterday would have been the best place to begin. These insights are urgent, and you require them as soon as your company grows. A lot of saving time is dependent on automation. Lanteria customers usually claim to reduce the time taken to produce reports from weeks to a few seconds.
Start small. At least do not attempt to measure 100 things on day one. Target "Headcount," "Turnover”, and "Time to Hire. Once your data maturity has increased, transition to predictive analytics and AI-driven forecasting.
TL;DR: The Quick Takeaway
HR Dashboards transform raw data into actionable visuals for the executives.
Lanteria HR offers the modular data, such as Core HR, Time, Performance, and Learning.
Power BI integration is available for custom and real-time reporting.
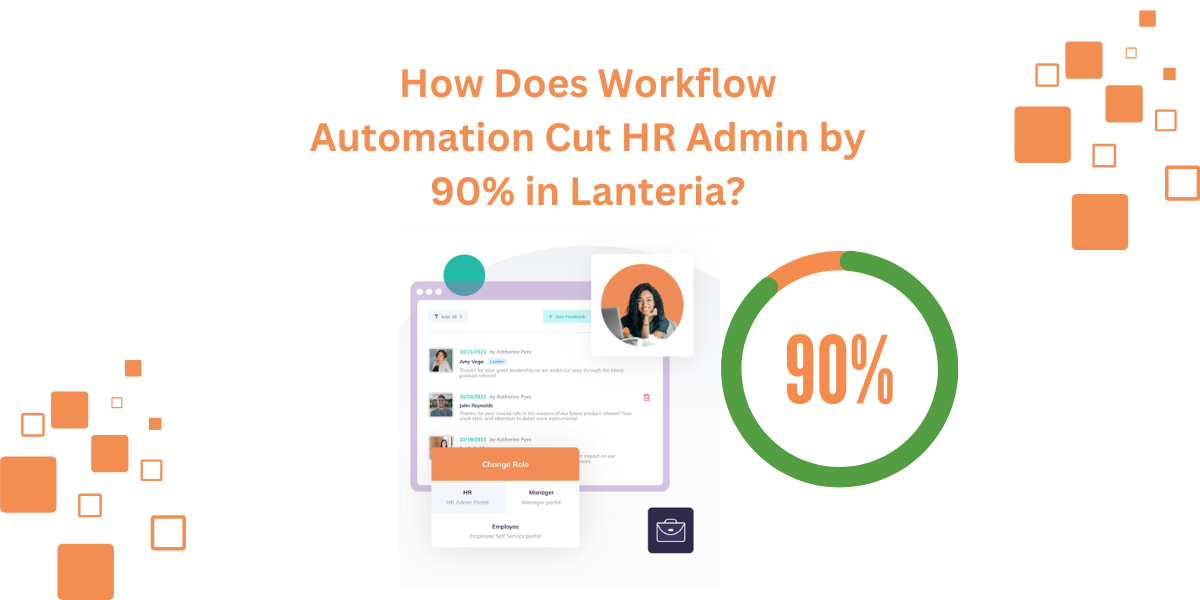
There is also much higher efficiency, which can save 75% or more of manual reporting effort.
Conclusion
The transformation of the administrative HR to Strategic is driven by data. The combination of the powerful reporting of Lanteria and the graphic strength of Power BI will enable the leaders make decisions without fear. This eliminates the use of assumptions and guesses are substituted.
Quit speculating as to why people are going or where your budget goes. Look ahead and be on point. Get all your employee information in one place and reduce your HR technology stack.
FAQs
Is Lanteria HR Compatible With Office 365?
Lanteria HR is biased on SharePoint and fully compatible with Microsoft 365, including Teams, Azure AD, and Power BI.
What Are The Pricing Options For Lanteria?
Lanteria provides modular and flexible pricing and can provide custom quotes at any time.
Is My Employee Data Secure?
Yes, your workforce will remain in your secure Microsoft cloud and undergo enterprise security standards.
Get more HR trends, news, tips and guides to streamline your operations. We promise we don’t spam.
We care about the protection of your data. Read our Privacy policy.
REVIEWS
Here’s what our customers say
Ekaterina K.
"Top-notch HR solution with excellent support team"
I was able to tailor the system to fit the unique needs of my organization, from creating custom fields to setting up workflows and approvals. This level of flexibility made it so easy to integrate into our existing HR processes, and it's made a real difference in our daily operations.
"Lanteria is a top SharePoint HR software with a great team behind it"
Lanteria HR is a great product that has even better team behind it. And as for a SharePoint-based product the Lanteria HR system looks very modern and runs quickly.
Akshay U.
"Lanteria is the most flexible and secure HRMS I had"
Our team is on Office 365, and Lanteria solves a big problem for us because it works so well with Microsoft products.
Hanna B.
"Al-star for employee performance management and reviews"
The Performance module gives us a straightforward dashboard where we can see all the vital stats about our employees' work performance. And, it updates in a flash so we're always in the know.